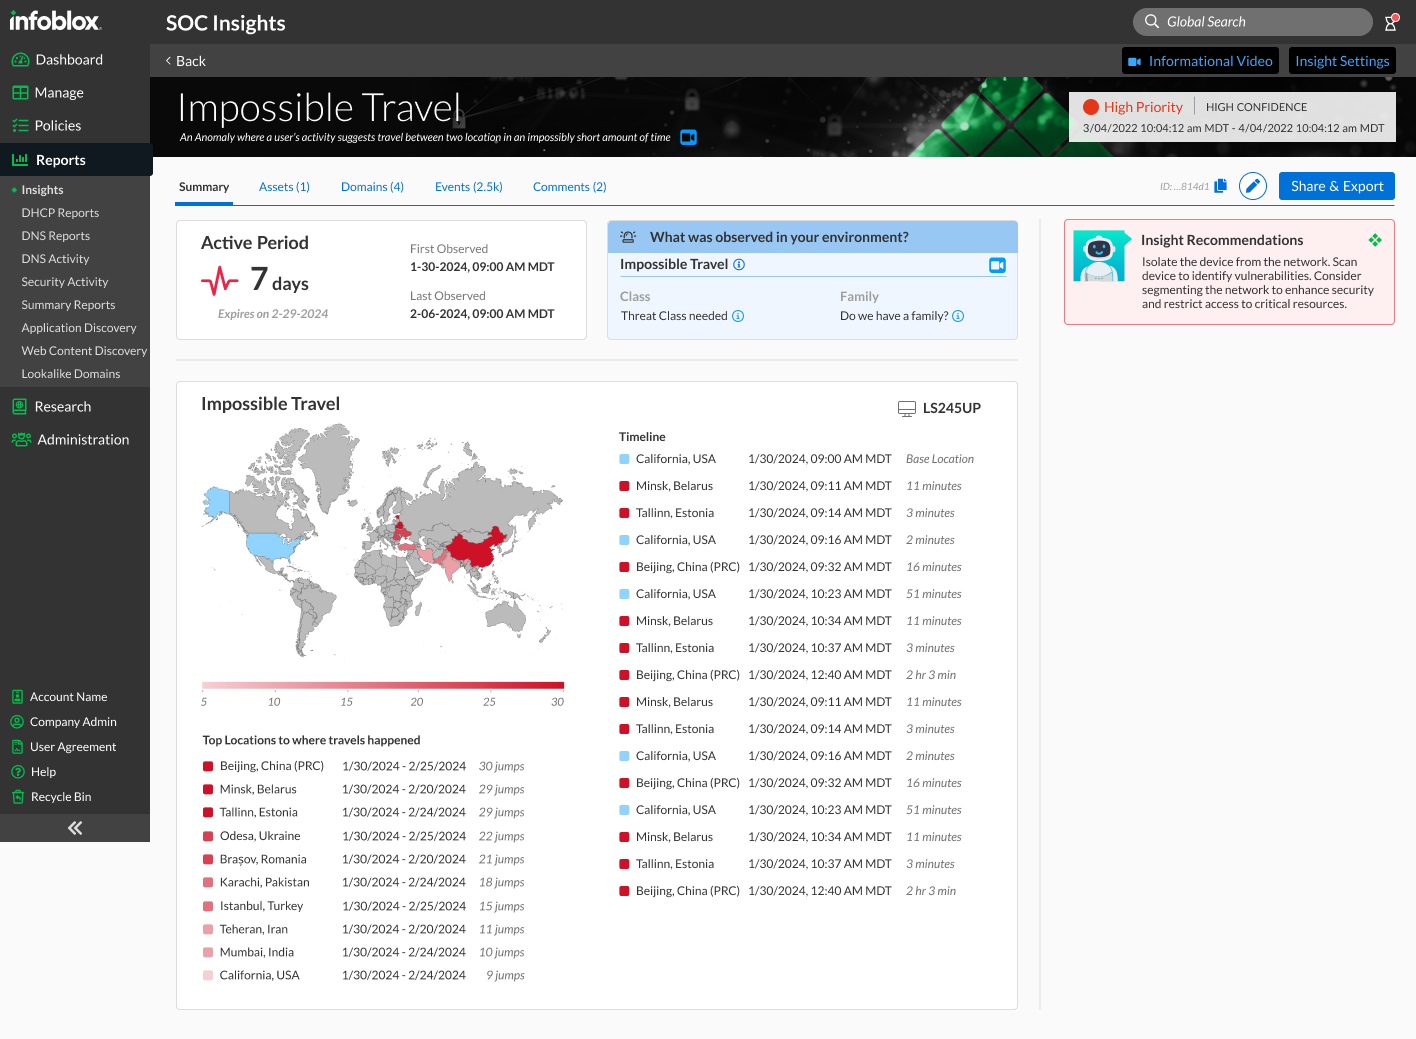
SOC Insights
As a UX Leader at Infoblox, I led a project to redesign our cybersecurity offering, focusing on improving the threat investigation process for security analysts. Our goal was to expand to the Total Available Market (TAM) for our cybersecurity offering. This case study outlines our user-centered approach to creating a more efficient and valuable solution.
Project Context
Infoblox aimed to:
Become an integral part of security operations
Enter new markets
Survive the consolidation of security tools
Leverage their extensive DNS data
Our challenge was to shift from a "set it and forget it" policy management approach to a solution that actively supports security analysts in their daily workflow.
Research and Discovery
We conducted extensive user research from June to August, focusing on security analysts involved in threat investigation. Our research revealed several key insights:
Analysts typically use multiple disconnected tools throughout security operations
Infoblox's Dossier tool was only addressing a small part of the overall security process
The majority of identified "events" were false positives
Investigating critical threats was time-consuming and challenging
Many analysts manually created incident reports for IT support and management
User Personas
We identified the Security Analyst as our primary persona, with secondary personas including:
IT Host/Deployment & Policy Manager
Threat Researcher
Policy Creator
Remediator
Current Customer Journey
The existing process for security analysts involved several manual steps:
Reviewing numerous events daily (sometimes thousands)
Verifying cyber threats through data queries and log extraction
Checking for false positives and closing out non-threats
Creating detailed reports and cases for Tier 2 analysts
Manually compiling incident reports for IT support and management
Proposed Solution: Optimized Journey
To address these pain points, we designed a two-phase solution:
Phase 1: Focus on True Incidents
Threat Notification: Analysts receive high-priority threat notifications through their preferred channels and view a prioritized list of threats.
Threat Review: Analysts can quickly view threat details, including threat feed data, impacted devices, and event timelines.
Efficient Triage: The system allows for easy determination of whether further investigation is needed, closing out false positives, and changing threat status.
Streamlined Workflow: Cases can be automatically sent to Tier 2 or IT support for remediation
Phase 2: Providing Intelligence
Automated Investigation: Implement machine learning to determine the point of entry and extent of reach for threats.
Smart Remediation: The system suggests or implements potential remediation actions.
Automated Reporting: Incident reports are automatically generated and sent to IT support and SecOps management, including actionable recommendations
Design Objectives
Increase Total Available Market (TAM)
Decrease time to detect a threat
Show the value of user research to the organization
Design Process
We followed a user-centered design approach:
Created initial wireframes based on existing patterns
Held weekly collaboration sessions with Product and Engineering
Conducted 7 rounds of user testing and revision
Throughout the process, we adhered to technical and business constraints, such as reusing existing components and ensuring we didn't cannibalize business from our existing Dossier product.
Key Design Iterations
Summary of Incident View:
Introduced a unified threat score with visual indicators
Provided status information and action recommendations
Assets View:
Implemented a node map to show relationships between assets
Displayed critical asset data and locations
Threat Activity View:
Utilized a monthly heatmap for visualizing threat activity
Displayed detailed data below the graphic as an alternate view
Delivered Designs
Based on findings from research, we:
Added a summary of all insights to know what remains open
Introduced an accordion pattern to see more details
Added KPIs for a quick snapshot
Our technical audience wanted detailed data quickly. In our designs, the primary views became data tables with visualizations providing additional context.
Users did not always want the system to automatically execute remediation; however, they did want recommendations on what should be done.
Results and Impact
The impact of conducting this research not only led to success with this project, but it also helped the growth and development of the team. By doing the research on threat investigation, we designed and developed a novel solution which led to a 15% increase in our product’s total available market. Customers were reporting a more than 25% decrease in time to detect a threat. In addition, I was able to show the value of research which led to an increase in headcount allowing me to add 4 researchers over the next two years. Plus, the designers, who had gained research skills, were heavily involved in the research and acquired more marketable skills.


